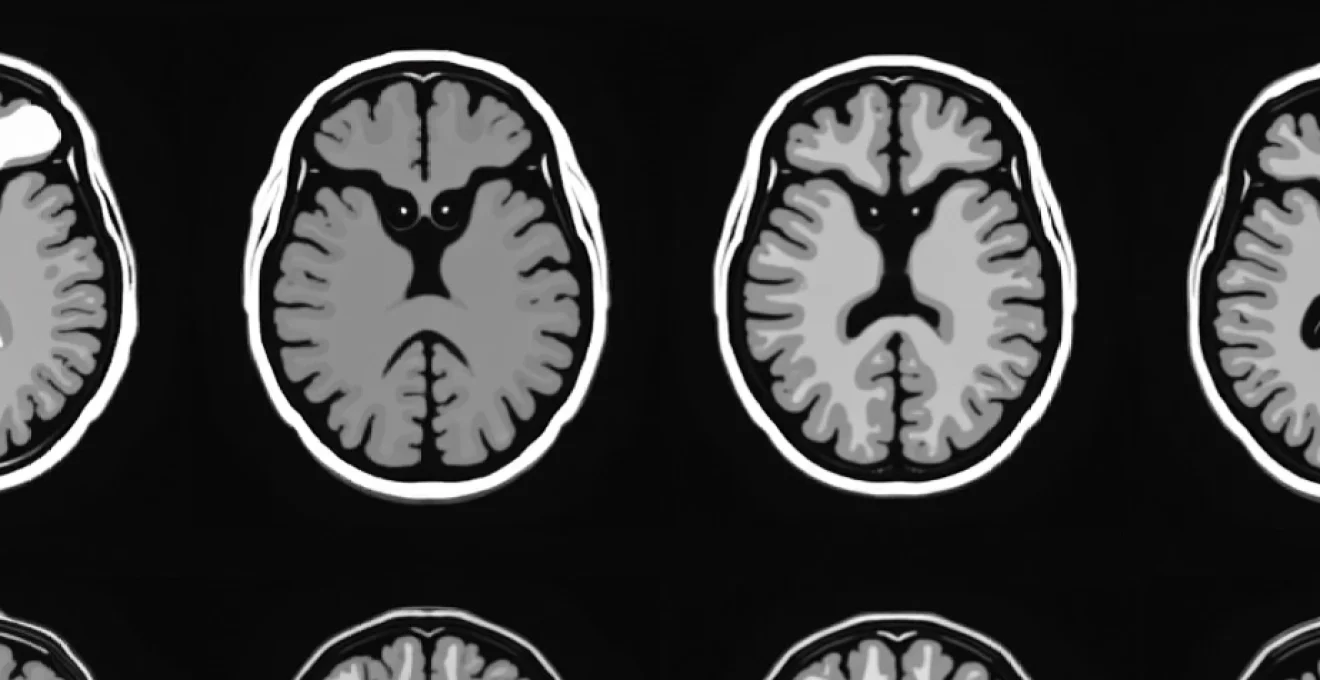
Small black holes appearing on brain MRI scans represent one of the most intriguing yet challenging aspects of neuroimaging interpretation. These hypointense lesions, typically measuring less than 5mm in diameter, can arise from various pathological processes including demyelination, microbleeds, lacunar infarcts, and iron deposition. The accurate identification and characterisation of these lesions requires sophisticated understanding of different MRI sequences and their technical parameters. When you encounter these findings on imaging reports, understanding their clinical significance becomes crucial for appropriate patient management and prognostic assessment.
The complexity of interpreting small black holes stems from their diverse aetiologies and the subtle differences in their imaging characteristics across various MRI sequences. Advanced neuroimaging techniques have revolutionised our ability to detect and analyse these minute lesions, providing unprecedented insights into their pathophysiology and clinical implications. Modern radiological practice demands comprehensive assessment using multiple imaging modalities to achieve accurate differential diagnosis and guide therapeutic decisions.
T2-weighted and FLAIR sequence characteristics of small black holes
T2-weighted imaging forms the cornerstone of small black hole detection, offering exceptional sensitivity for identifying subtle signal abnormalities within brain parenchyma. The fundamental principle relies on tissue-specific T2 relaxation times, where pathological processes alter the normal signal characteristics of brain tissue. Small black holes typically manifest as focal areas of signal loss on T2-weighted sequences, contrasting sharply with the surrounding hyperintense cerebrospinal fluid and brain tissue.
Signal intensity patterns on T2-Weighted imaging
The signal intensity patterns observed on T2-weighted imaging provide crucial diagnostic clues for characterising small black holes. Chronic demyelinating lesions often demonstrate marked hypointensity due to tissue destruction and gliosis, whilst acute inflammatory changes may show variable signal characteristics depending on the degree of oedema and cellular infiltration. The surrounding perilesional area frequently exhibits subtle hyperintensity, reflecting ongoing inflammatory processes or secondary changes in tissue architecture.
Quantitative analysis of signal intensity values has emerged as a valuable tool for distinguishing between different types of small black holes. Research indicates that chronic multiple sclerosis lesions demonstrate significantly lower T2 signal intensities compared to acute inflammatory lesions, with mean values often falling below 60% of normal white matter intensity. This quantitative approach enhances diagnostic accuracy and reduces inter-observer variability in lesion characterisation.
FLAIR sequence hypointense lesion recognition
Fluid-attenuated inversion recovery (FLAIR) sequences excel at suppressing cerebrospinal fluid signal, thereby improving visualisation of small periventricular and cortical lesions. The hypointense appearance of small black holes on FLAIR imaging often indicates severe tissue damage with significant loss of normal cellular architecture. These lesions frequently appear more conspicuous on FLAIR compared to conventional T2-weighted sequences, particularly when located adjacent to ventricular surfaces or cortical regions.
The temporal evolution of lesion appearance on FLAIR sequences provides valuable insights into disease progression and treatment response. Acute lesions may initially show hyperintense or isointense signals before evolving into characteristic hypointense black holes over months to years. This transformation reflects the underlying pathological processes of inflammation, demyelination, and subsequent tissue repair or destruction.
Gradient echo T2* susceptibility artefacts
Gradient echo T2* sequences demonstrate exceptional sensitivity to susceptibility effects, making them indispensable for detecting iron-containing deposits and microbleeds. Small black holes appearing on these sequences often indicate the presence of haemosiderin deposition, chronic microhaemorrhages, or abnormal iron accumulation. The characteristic blooming artefact associated with susceptibility effects can make lesions appear larger than their actual size, necessitating careful correlation with other imaging sequences.
Technical parameters significantly influence the appearance of susceptibility artefacts on gradient echo sequences. Lower echo times and higher magnetic field strengths increase sensitivity to subtle iron deposits, whilst longer echo times enhance the visualisation of larger haemorrhagic lesions. Optimal imaging protocols typically employ echo times between 15-25ms at 1.5T and 10-15ms at 3T to achieve balanced sensitivity and specificity for small black hole detection.
Spin echo versus fast spin echo differentiation
The choice between spin echo and fast spin echo sequences impacts the visualisation and characterisation of small black holes. Traditional spin echo sequences provide superior contrast resolution and reduced susceptibility to motion artefacts, making them ideal for detecting subtle signal abnormalities. However, longer acquisition times limit their practical application in routine clinical practice. Fast spin echo techniques offer reduced scan times whilst maintaining adequate image quality for most diagnostic purposes.
Recent developments in accelerated imaging techniques, including parallel imaging and compressed sensing, have addressed many limitations of conventional sequences. These advanced methods enable acquisition of high-resolution T2-weighted images with improved signal-to-noise ratios and reduced scan times. The enhanced spatial resolution facilitates detection of smaller lesions that might be missed on standard sequences, improving diagnostic accuracy for subtle pathological changes.
Microbleeds and haemosiderin deposition detection protocols
Cerebral microbleeds represent focal deposits of haemosiderin-laden macrophages following microscopic haemorrhages, appearing as small round hypointense lesions on gradient echo and susceptibility-weighted imaging. These lesions typically measure 2-10mm in diameter and demonstrate characteristic blooming artefacts on susceptibility-sensitive sequences. The detection and characterisation of microbleeds requires standardised imaging protocols with optimised parameters to ensure consistent identification across different scanning platforms and field strengths.
Advanced susceptibility-weighted imaging techniques have revolutionised microbleed detection, revealing previously undetectable lesions and providing insights into their clinical significance in various neurological conditions.
Susceptibility-weighted imaging (SWI) technical parameters
Susceptibility-weighted imaging represents the gold standard for microbleed detection, offering superior sensitivity compared to conventional gradient echo sequences. Optimal SWI protocols employ long echo times (typically 25-40ms at 1.5T and 15-25ms at 3T) to maximise susceptibility contrast whilst maintaining adequate signal-to-noise ratios. The acquisition of high-resolution data with isotropic voxels enables multiplanar reconstructions and improves lesion conspicuity through reduced partial volume effects.
Phase information processing constitutes a critical component of SWI image reconstruction, requiring careful attention to phase unwrapping algorithms and filtering techniques. Modern SWI implementations utilise sophisticated phase processing methods to suppress background field variations whilst preserving lesion-related phase changes. The resulting magnitude and phase images are combined using multiplicative operations to create final SWI images with enhanced contrast between diamagnetic and paramagnetic tissues.
Cerebral amyloid angiopathy microhaemorrhage patterns
Cerebral amyloid angiopathy typically produces a characteristic distribution pattern of microbleeds predominantly affecting cortical and subcortical regions. These lesions commonly involve the posterior cerebral areas, including occipital, parietal, and temporal lobes, whilst sparing deep grey matter structures and brainstem regions. The strictly lobar distribution helps differentiate amyloid-related microbleeds from hypertensive microangiopathy, which preferentially affects deep brain structures.
Quantitative analysis of microbleed burden in cerebral amyloid angiopathy reveals important correlations with cognitive decline and haemorrhagic risk. Studies demonstrate that patients with more than 10 strictly lobar microbleeds have significantly increased risks of future intracerebral haemorrhage, particularly when considering anticoagulation therapy. This information proves invaluable for clinical decision-making regarding stroke prevention strategies in elderly patients with multiple comorbidities.
Hypertensive microbleeds distribution analysis
Hypertensive microangiopathy produces a distinctly different distribution pattern compared to cerebral amyloid angiopathy, primarily affecting deep brain structures including basal ganglia, thalamus, and brainstem regions. The pathophysiology involves chronic hypertension-induced changes in small perforating arteries, leading to lipohyalinosis and subsequent microhaemorrhages. These lesions frequently coexist with other markers of small vessel disease, including lacunar infarcts and white matter hyperintensities.
The temporal evolution of hypertensive microbleeds provides insights into disease progression and treatment response. Serial imaging studies demonstrate that effective blood pressure control can reduce the rate of new microbleed formation, whilst poorly controlled hypertension is associated with accelerated lesion accumulation. This observation supports the importance of aggressive cardiovascular risk factor modification in patients with established small vessel disease.
Phase contrast imaging for iron quantification
Phase contrast imaging techniques enable quantitative assessment of brain iron content by measuring susceptibility-induced phase shifts in MRI signals. These methods provide non-invasive biomarkers for monitoring iron accumulation in various neurological conditions, including multiple sclerosis, Parkinson’s disease, and neurodegeneration with brain iron accumulation disorders. Quantitative susceptibility mapping has emerged as the most sophisticated approach for measuring tissue iron concentrations with high spatial resolution.
Recent advances in iron quantification methodology have improved the accuracy and reproducibility of measurements across different scanning platforms. Standardised protocols incorporating temperature correction, reference region normalisation, and quality control metrics ensure reliable quantitative results suitable for longitudinal monitoring and multi-centre studies. These developments facilitate the use of iron quantification as a potential biomarker for disease progression and treatment response assessment.
Lacunar infarcts versus perivascular spaces discrimination
Distinguishing between lacunar infarcts and enlarged perivascular spaces represents one of the most challenging aspects of small vessel disease interpretation. Both entities appear as small fluid-filled cavities on imaging but have fundamentally different pathophysiological origins and clinical implications. Lacunar infarcts result from occlusion of small perforating arteries, leading to focal tissue necrosis and subsequent cavitation. In contrast, perivascular spaces are anatomical structures that become more prominent with age and various pathological conditions but do not necessarily indicate focal tissue damage.
The morphological characteristics provide important clues for differentiation between these entities. Lacunar infarcts typically demonstrate irregular shapes with surrounding gliosis, appearing hyperintense on FLAIR sequences due to associated tissue changes. Perivascular spaces maintain smooth, regular contours and follow the expected anatomical course of perforating vessels, appearing isointense to cerebrospinal fluid on all sequences without surrounding signal abnormalities. Size criteria also contribute to differential diagnosis, with lacunar infarcts generally measuring larger than 3mm in diameter, whilst most perivascular spaces remain below this threshold.
Advanced imaging techniques enhance discrimination between these morphologically similar lesions. Diffusion tensor imaging reveals disrupted white matter integrity surrounding lacunar infarcts but preserves normal tissue architecture around perivascular spaces. Arterial spin labelling perfusion imaging may demonstrate subtle perfusion abnormalities adjacent to lacunar infarcts, reflecting compromised vascular supply in the affected territory. These functional imaging markers provide additional confidence in differential diagnosis when morphological features alone prove insufficient for definitive characterisation.
Multiple sclerosis black holes and T1 hypointense lesions
Multiple sclerosis black holes represent areas of severe tissue destruction where the normal brain architecture has been irreversibly damaged through inflammatory demyelination and axonal loss. These lesions appear as focal areas of marked hypointensity on T1-weighted images, contrasting sharply with the surrounding normal brain tissue. The development of black holes correlates strongly with disease progression and disability accumulation, making them important prognostic markers in multiple sclerosis management.
The pathological substrate underlying black hole formation involves complex interactions between inflammatory cell infiltration, demyelination, and secondary axonal degeneration. Initially, acute inflammatory lesions may show mild T1 hypointensity due to oedema and cellular infiltration. However, persistent inflammation leads to irreversible tissue damage, resulting in the characteristic black hole appearance that reflects areas of reduced tissue density and increased water content. This progression from acute inflammation to chronic tissue destruction typically occurs over months to years, providing a window of opportunity for therapeutic intervention.
Chronic T1 black holes in Relapsing-Remitting MS
Chronic T1 black holes in relapsing-remitting multiple sclerosis demonstrate remarkable stability over time, with most lesions showing minimal changes in size or signal characteristics once established. Longitudinal studies reveal that approximately 30-40% of acute inflammatory lesions eventually evolve into permanent black holes, whilst the remainder show varying degrees of signal recovery. The factors determining this differential evolution remain incompletely understood but likely involve genetic susceptibility, lesion location, and the adequacy of tissue repair mechanisms.
The clinical significance of chronic black holes extends beyond their role as markers of tissue destruction. Research demonstrates strong correlations between black hole volume and measures of cognitive impairment, particularly in domains of processing speed and executive function. This relationship persists even after controlling for overall lesion burden and brain atrophy, suggesting that the quality of tissue damage, rather than quantity alone, influences clinical outcomes in multiple sclerosis.
Gadolinium enhancement patterns in active demyelination
Gadolinium enhancement patterns provide crucial insights into the inflammatory activity and blood-brain barrier integrity in multiple sclerosis lesions. Active demyelinating lesions typically demonstrate ring-like or nodular enhancement patterns that reflect ongoing inflammatory processes and disrupted vascular permeability. The duration and intensity of enhancement correlate with the severity of inflammatory activity, with most lesions showing enhancement for 4-8 weeks following initial formation.
Advanced contrast-enhanced imaging techniques , including delayed post-contrast sequences and higher gadolinium doses, can reveal subtle enhancement patterns that might be missed on standard protocols. These approaches prove particularly valuable for detecting low-grade inflammatory activity in lesions that appear inactive on conventional sequences. The identification of subtle ongoing inflammation has important therapeutic implications, as it may indicate suboptimal disease control requiring treatment modification.
Magnetisation transfer ratio assessment
Magnetisation transfer imaging provides quantitative measures of tissue integrity by assessing the interaction between free and bound water protons in brain tissue. Multiple sclerosis lesions demonstrate reduced magnetisation transfer ratios reflecting loss of normal tissue architecture and myelin content. This technique offers superior sensitivity for detecting subtle tissue changes compared to conventional MRI sequences, revealing abnormalities in normal-appearing white matter that may represent early disease involvement.
The prognostic value of magnetisation transfer measurements has been demonstrated in numerous longitudinal studies. Patients with lower baseline magnetisation transfer ratios in lesional tissue show greater subsequent disability progression and cognitive decline. Furthermore, magnetisation transfer metrics correlate more strongly with clinical outcomes than traditional measures of lesion volume or count, supporting their potential utility as surrogate endpoints in clinical trials and therapeutic monitoring.
Double inversion recovery sequence applications
Double inversion recovery sequences simultaneously suppress both cerebrospinal fluid and white matter signals, providing exceptional contrast for detecting cortical and juxtacortical lesions. These sequences reveal cortical demyelinating lesions that may be invisible on conventional imaging, contributing to a more comprehensive assessment of disease burden in multiple sclerosis. Research using double inversion recovery techniques has fundamentally altered our understanding of cortical involvement in multiple sclerosis, revealing extensive grey matter pathology previously underappreciated.
The clinical relevance of cortical lesions detected by double inversion recovery imaging continues to emerge through ongoing research. Cortical lesion burden correlates strongly with cognitive impairment, particularly in domains of memory and executive function. Additionally, cortical lesions show different temporal dynamics compared to white matter lesions, with many remaining stable over extended periods whilst others demonstrate progressive expansion. This heterogeneous behaviour suggests distinct pathophysiological mechanisms underlying cortical versus white matter involvement in multiple sclerosis.
Differential diagnosis framework for small hypointense foci
Establishing a systematic approach to interpreting small hypointense foci requires careful consideration of patient demographics, clinical presentation, lesion characteristics, and imaging findings across multiple sequences. Age represents a crucial factor, as certain conditions show distinct age-related distributions. For instance, developmental venous anomalies commonly present in younger patients, whilst age-related small vessel disease becomes increasingly prevalent after the fifth decade of life. Gender-specific considerations also influence differential diagnosis, with multiple sclerosis showing a female predominance and certain genetic conditions demonstrating sex-linked inheritance patterns.
The anatomical distribution of small hypointense foci provides valuable diagnostic clues that narrow the differential diagnosis significantly. Periventricular lesions suggest demyelinating disease or small vessel ischaemia, whilst subcortical lesions may indicate hypertensive microangiopathy or cerebral amyloid angiopathy. Brainstem involvement raises suspicion for inflammatory conditions, vascular malformations, or metabolic disorders. Deep grey matter lesions might suggest toxic exposures, metabolic diseases, or specific genetic conditions affecting brain iron metabolism.
The integration of clinical history, lesion morphology, and advanced imaging characteristics forms the foundation for accurate differential diagnosis of small brain lesions, requiring systematic evaluation of each component to achieve diagnostic confidence.
Lesion evolution patterns provide additional diagnostic information, with certain conditions showing characteristic temporal changes. Multiple sclerosis lesions often demonstrate acute enhancement followed by gradual signal recovery or evolution into chronic black holes. Vascular lesions typically remain stable unless new ischaemic events occur, whilst inflammatory conditions may show fluctuating appearances corresponding to disease activity cycles. Serial imaging assessment becomes invaluable for distinguishing between these different pathophysiological processes.
Advanced MRI techniques for small black hole characterisation
Modern neuroimaging employs sophisticated techniques that transcend conventional structural imaging limitations, providing unprecedented insights into the microstructural and functional properties of small brain lesions. These advanced methodologies enable quantitative assessment of tissue characteristics that remain invisible to standard imaging sequences, facilitating more accurate diagnosis and monitoring of disease progression. The integration of multiple advanced techniques creates a comprehensive picture of lesion pathophysiology, supporting evidence-based therapeutic decisions and prognostic assessments.
The technical complexity of advanced MRI techniques requires careful optimisation of acquisition parameters and post-processing algorithms to achieve reliable results. Quality control measures become particularly critical when dealing with small lesions, where partial volume effects and motion artefacts can significantly impact quantitative measurements. Standardised protocols incorporating phantom validation and cross-platform calibration ensure reproducible results across different scanning systems and imaging centres.
Diffusion tensor imaging fractional anisotropy values
Diffusion tensor imaging reveals microstructural tissue properties by measuring water molecule movement patterns within brain tissue, providing sensitive markers of white matter integrity and organisation. Small black holes typically demonstrate reduced fractional anisotropy values reflecting disrupted tissue architecture and loss of directional water diffusion. Normal white matter exhibits high fractional anisotropy values (0.4-0.8) due to organised myelin sheaths that restrict perpendicular water movement, whilst damaged tissue shows significantly lower values (0.1-0.3) indicating structural breakdown.
The spatial extent of fractional anisotropy abnormalities often exceeds the boundaries of lesions visible on conventional imaging, revealing subclinical tissue damage in apparently normal brain regions. This phenomenon proves particularly relevant in multiple sclerosis, where normal-appearing white matter demonstrates subtle but measurable diffusion abnormalities that may represent early disease involvement. Longitudinal studies tracking fractional anisotropy changes provide insights into disease progression and treatment response that complement traditional imaging metrics.
Advanced diffusion analysis techniques, including diffusion kurtosis imaging and neurite orientation dispersion, offer enhanced sensitivity for detecting subtle microstructural changes. These methods capture non-Gaussian diffusion properties that reflect tissue complexity beyond simple anisotropy measures. Research demonstrates superior correlation between these advanced diffusion metrics and clinical disability compared to conventional fractional anisotropy measurements, suggesting potential applications as sensitive biomarkers for therapeutic monitoring.
Perfusion-weighted imaging cerebral blood volume maps
Perfusion-weighted imaging techniques assess tissue vascular properties by measuring cerebral blood volume, blood flow, and transit times within small brain lesions and surrounding tissue. Dynamic susceptibility contrast imaging employs rapid gadolinium bolus tracking to generate quantitative perfusion maps with high spatial resolution. Small black holes may demonstrate variable perfusion patterns depending on their underlying pathology, with inflammatory lesions showing increased blood volume whilst chronic ischaemic lesions exhibit reduced perfusion values.
Arterial spin labelling provides non-invasive perfusion assessment without contrast administration, making it particularly suitable for longitudinal monitoring and paediatric applications. This technique labels arterial blood water molecules using radiofrequency pulses, creating endogenous contrast for perfusion measurement. Research indicates that arterial spin labelling can detect subtle perfusion abnormalities surrounding small lesions that may indicate compromised tissue viability or ongoing inflammatory activity.
Perfusion imaging proves especially valuable for distinguishing between different types of small brain lesions that appear morphologically similar on conventional sequences. Tumours typically show elevated cerebral blood volume due to neoangiogenesis, whilst inflammatory lesions demonstrate variable enhancement patterns depending on disease activity. Chronic infarcts exhibit persistently reduced perfusion values, helping differentiate them from other hypointense lesions that may show preserved or increased vascular supply.
Magnetic resonance spectroscopy metabolite analysis
Magnetic resonance spectroscopy enables non-invasive biochemical analysis of brain tissue by detecting specific metabolite concentrations within regions of interest. N-acetylaspartate serves as a marker of neuronal integrity, typically showing reduced concentrations in areas of axonal damage or loss. Choline compounds reflect cell membrane turnover and may increase in inflammatory conditions or tumours, whilst creatine provides a relatively stable reference for metabolite ratio calculations.
Single-voxel spectroscopy techniques focus on individual small lesions to obtain detailed metabolite profiles that aid in differential diagnosis. Multiple sclerosis lesions typically demonstrate decreased N-acetylaspartate/creatine ratios with variable choline elevations depending on inflammatory activity. Acute demyelinating lesions may show prominent lactate peaks indicating anaerobic metabolism, whilst chronic lesions often exhibit severely depleted metabolite concentrations reflecting tissue destruction.
Chemical shift imaging extends spectroscopic analysis to multiple voxels simultaneously, creating metabolite maps that reveal spatial distribution patterns around small lesions. This technique proves particularly valuable for assessing the extent of metabolic abnormalities beyond morphologically visible lesion boundaries. Research demonstrates that metabolic changes often precede structural alterations, potentially identifying tissue at risk for future damage and informing therapeutic interventions.
Quantitative susceptibility mapping iron content assessment
Quantitative susceptibility mapping represents the most advanced technique for measuring brain iron content with high spatial resolution and quantitative accuracy. This method reconstructs tissue magnetic susceptibility values from phase images acquired with gradient echo sequences, providing direct measurements of iron concentration in micrograms per gram of tissue. Small black holes containing iron deposits typically demonstrate positive susceptibility values proportional to their iron content, enabling precise quantification and longitudinal monitoring.
The technical implementation of quantitative susceptibility mapping requires sophisticated post-processing algorithms to address phase unwrapping, background field removal, and susceptibility reconstruction challenges. Modern approaches employ advanced regularisation techniques and multi-orientation acquisition strategies to improve reconstruction accuracy and reduce artefacts. Quality control measures include phantom validation studies and reproducibility assessments to ensure reliable quantitative results across different scanning platforms.
Clinical applications of quantitative susceptibility mapping span multiple neurological conditions where iron accumulation plays pathophysiological roles. In multiple sclerosis, iron deposition in lesions correlates with tissue damage severity and clinical disability progression. Neurodegenerative conditions demonstrate characteristic iron accumulation patterns in specific brain regions, whilst cerebral microbleeds show distinct susceptibility signatures that aid in differential diagnosis. The quantitative nature of these measurements enables objective disease monitoring and treatment response assessment that surpasses qualitative visual inspection methods.
Research continues to expand the applications of quantitative susceptibility mapping in clinical practice, with ongoing studies investigating its utility as a biomarker for disease progression and therapeutic monitoring. The technique’s ability to detect subtle iron changes preceding structural alterations makes it particularly promising for early disease detection and neuroprotective treatment development. As standardised protocols and analysis methods become widely available, quantitative susceptibility mapping is poised to become an essential tool in advanced neuroimaging practice.